
The World’s Most Deceptive Chart
March 6th, 2017 by Jason B. Vanclef
I received an email last week which I thought was worth discussing.
“I just found your site and began reading the backlog of posts on the importance of managing risk and avoiding draw downs. However, the following chart would seem to counter that argument. In the long-term, bear markets seem harmless (and relatively small) as this literature would indicate?”
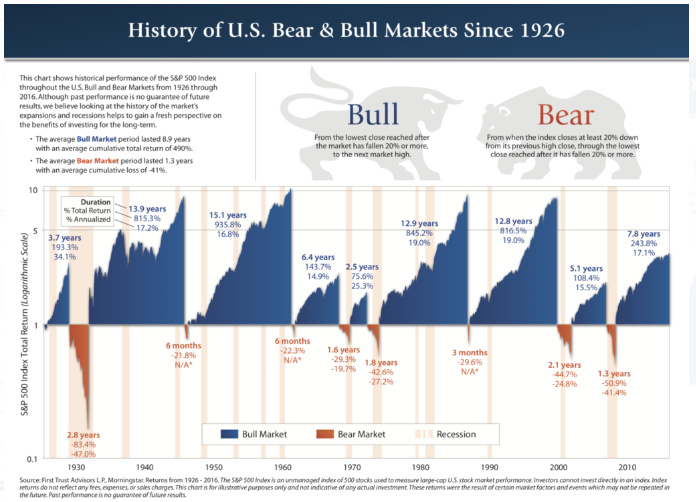
This same chart has been floating around the “inter-web,” in a couple of different forms for the last couple of months. Of course, if you study it at “face value” it certainly would appear that staying invested all the time certainly seems to be the optimal strategy.
The problem is the entire chart is deceptive.
More importantly, for those saving and investing for their retirement, it’s dangerous.
Here is why.
The first problem is the most obvious, and a topic I have addressed many times in past missives, you must worry about corrections.
“The problem is you DIED long before ever achieving that 5% annualized long-term return.
Let’s look at this realistically.
The average American faces a real dilemma heading into retirement. Unfortunately, individuals only have a finite investing time horizon until they retire.
Therefore, as opposed to studies discussing “long term investing” without defining what the “long term” actually is – it is “TIME” that we should be focusing on.
Think about it for a moment. Most investors don’t start seriously saving for retirement until they are in their mid-40’s. This is because by the time they graduate college, land a job, get married, have kids and send them off to college, a real push toward saving for retirement is tough to do as incomes, while growing, haven’t reached their peak. This leaves most individuals with just 20 to 25 productive work years before retirement age to achieve investment goals.
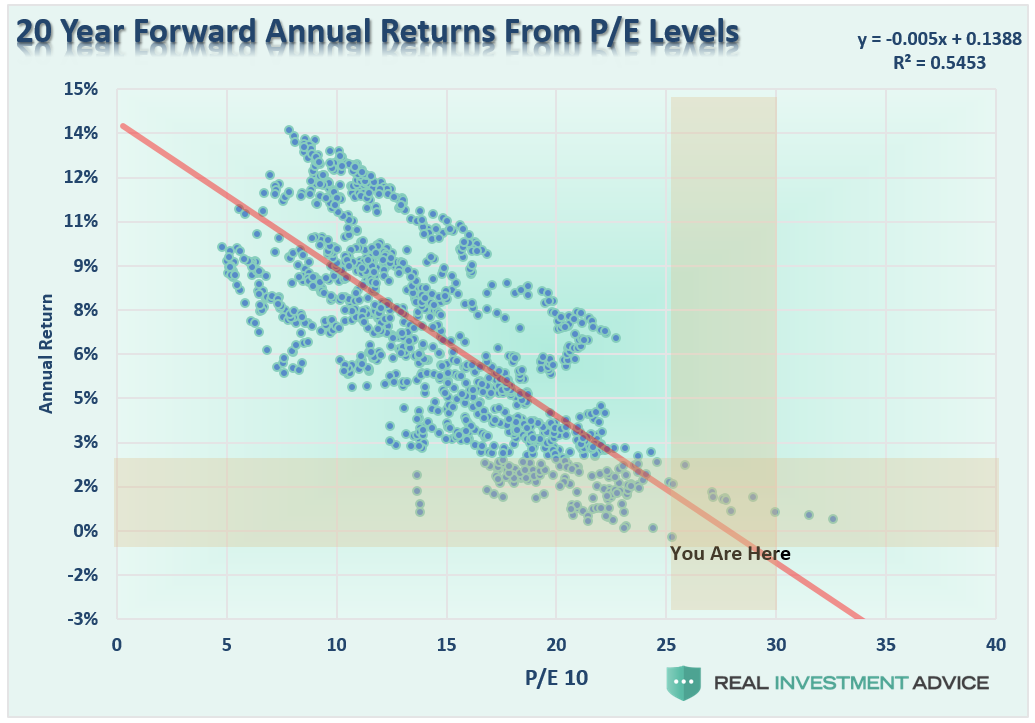
This is where the problem is. There are periods in history, where returns over a 20-year period have been close to zero or even negative.”
Like now.
It’s The Math
Outside of your personal longevity issue, it’s the “math” that is the primary problem.
The chart uses percentage returns which is extremely deceptive if you don’t examine the issue beyond a cursory glance. Let’s take a look at a quick example.
Let’s assume that an index goes from 1000 to 8000.
- 1000 to 2000 = 100% return
- 1000 to 3000 = 200% return
- 1000 to 4000 = 300% return
- …
- 1000 to 8000 = 700% return
Great, an investor bought the index and generated a 700% return on their money.
See, why worry about a 50% correction in the market when you just gained 700%. Right?
Here is the problem with percentages.
A 50% correction does NOT leave you with a 650% gain.
A 50% correction is a subtraction of 4000 points which reduces your 700% gain to just 300%.
Then the problem now becomes the issue of having to regain those 4000 lost points just to break even.
It’s Not A Nominal Issue
The bull/bear chart first presented above is also a nominal chart, or rather, not adjusted for inflation or dividends. (Dividends have accounted for about 40% of total returns since 1900.)
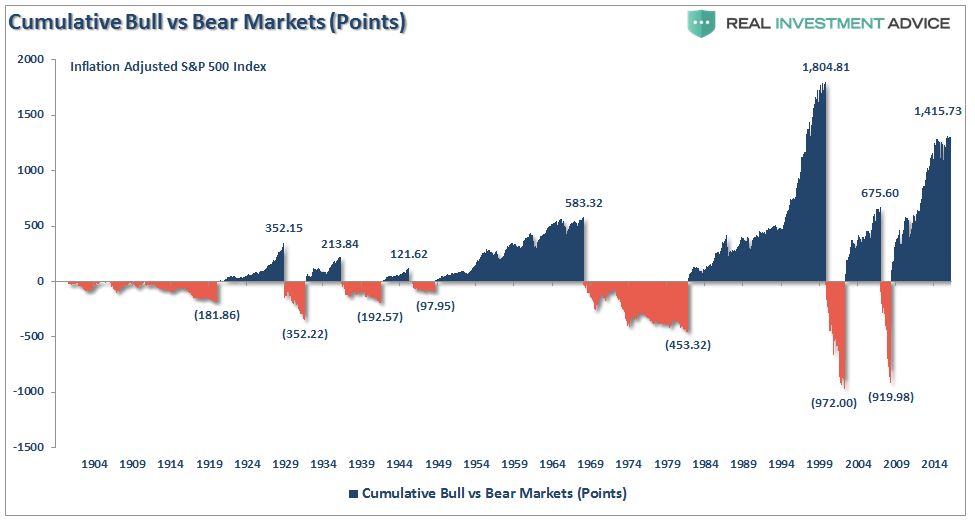
So, I have rebuilt the analysis presented above using inflation-adjusted, total return numbers using Dr. Robert Shiller’s monthly data.
The first chart shows the S&P 500 from 1900 to present and I have drawn my measurement lines for the bull and bear market periods.

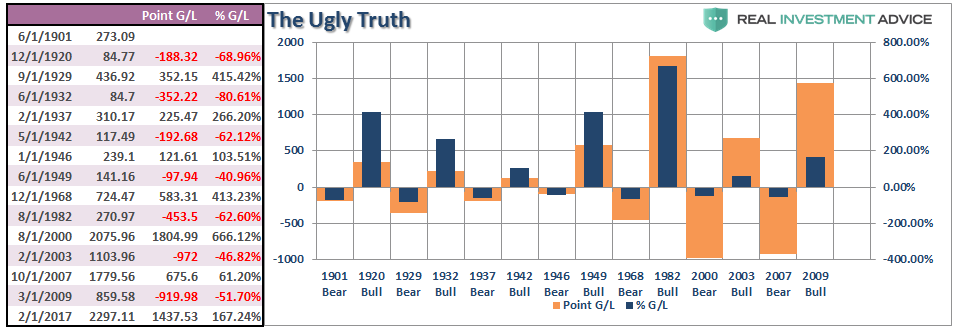
The table to the right is the most critical. The table shows the actual point gain and point loss for each period. As you will note, there are periods when the entire previous point gains have been either entirely, or almost entirely, destroyed.
The next two charts are a rebuild of the first chart above in both percentage and point movements.
Again, even on an inflation-adjusted, total return, basis when viewing the bull/bear periods in terms of percentage gains and losses, it would seem as if bear markets were not worth worrying about.

However, when reconstructed on a point gain/loss basis, the ugly truth is revealed.
It’s A “Time” Problem.
If you have discovered the secret to eternal life, then stop reading now.
For the rest of us mere mortals, time matters.
If you are near to, or entering, retirement, there is a strong argument to be made for seriously rethinking the amount of equity risk currently being undertaken in portfolios.
If you are a Millennial, as I pointed out recently, there is also a strong case for accumulating a large amount of cash and waiting for the next great investing opportunity.
Unfortunately, most investors remain woefully behind their promised financial plans. Given current valuations, and the ongoing impact of “emotional decision making,” the outcome is not likely going to improve over the next decade.
For investors, understanding potential returns from any given valuation point is crucial when considering putting their “savings” at risk. Risk is an important concept as it is a function of “loss”. The more risk that is taken within a portfolio, the greater the destruction of capital will be when reversions occur.
Many individuals have been led believe that investing in the financial markets is their only option for retiring. Unfortunately, they have fallen into the same trap as most pension funds which is believing market performance will make up for a “savings” shortfall.
However, the real world damage that market declines inflict on investors, and pension funds, hoping to garner annualized 8% returns to make up for the lack of savings is all too real and virtually impossible to recover from. When investors lose money in the market it is possible to regain the lost principal given enough time, however, what can never be recovered is the lost “time” between today and retirement.
“Time” is extremely finite and the most precious commodity that investors have.
In the end – yes, market corrections are indeed very bad for your portfolio in the long run. However, before sticking your head in the sand, and ignoring market risk based on an article touting “long-term investing always wins,” ask yourself who really benefits?
This time is “not different.”
The only difference will be what triggers the next valuation reversion when it occurs.
If the last two bear markets haven’t taught you this by now, I am not sure what will. Maybe the third time will be the “charm.”